Weather
Stride automatically attaches weather data to every outdoor activity and lets you forecast conditions for future routes. This helps you understand when the environment made a session harder or easier, and plan ahead for races and training.
Weather on activities#
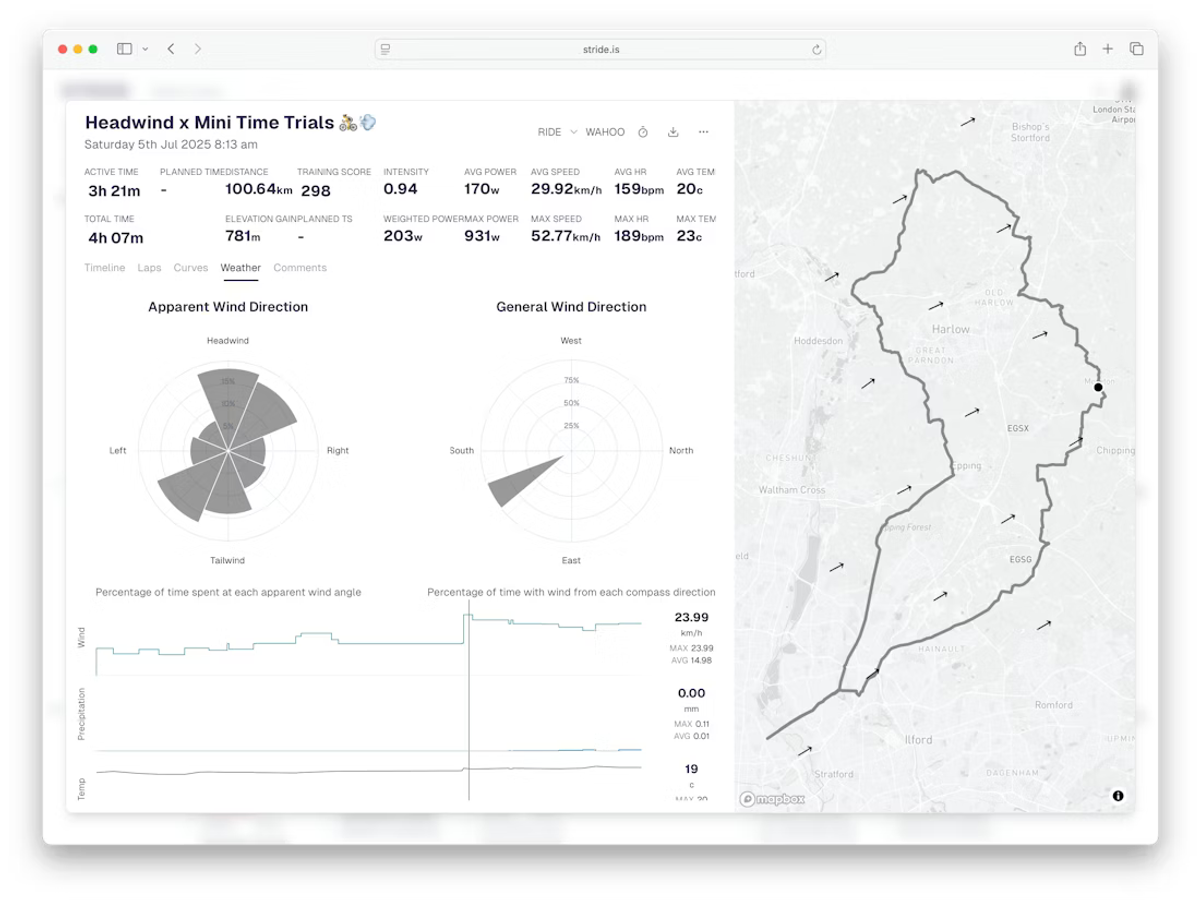
Every outdoor activity has a Weather tab in the activity analysis page. It shows conditions along the route, broken down into several graphs:
- Wind direction - two polar charts show the distribution of wind angles during the activity. The 45-degree chart gives a quick overview; the 20-degree chart provides finer detail.
- Wind speed - a line graph of wind speed (km/h) throughout the activity.
- Precipitation - rainfall in mm over time.
- Temperature - ambient temperature along the route.
Wind analysis#
The polar wind charts show both apparent wind (the combined effect of actual wind and your movement) and general wind direction from weather data along the route.
The charts break the wind into directional bins so you can see at a glance how much time you spent riding into a headwind, with a tailwind, or in a crosswind. This is particularly useful for explaining performance differences on out-and-back or loop routes where the same effort can produce very different speeds depending on wind direction.
Performance context#
Weather data helps you separate what came from you and what came from the environment. A slow average speed on a windy day does not necessarily mean a bad session. Similarly, a fast time with a strong tailwind is not quite the achievement it first appears.
When reviewing activities, consider:
- Headwind sections where speed dropped but power stayed consistent.
- Temperature effects on heart rate (heat pushes HR higher for the same effort).
Route weather forecasting#
Stride can forecast weather conditions for future routes, which is invaluable for race preparation and ride planning.
Importing Strava routes#
Drag a Strava route from the sidebar directly onto your Stride calendar. Stride will immediately show the predicted weather for that route on that day, including wind direction relative to the course, temperature, and precipitation probability.
Time optimisation#
Drag the planned activity to different time slots on the calendar to see how conditions change throughout the day. This lets you find the window with the least wind, the coolest temperature, or the lowest chance of rain.
Race day planning#
Import your race course days or weeks in advance and monitor how the forecast develops as race day approaches. Use the wind direction data to plan your pacing strategy, saving energy on headwind sections and pushing harder with a tailwind.
Tips#
- Compare the same route ridden on different days to see how wind patterns affected your time and effort.
- For time trials, import the course and experiment with start times to find minimal wind conditions.
- Check the temperature forecast before long sessions to plan hydration and clothing.